
Seafood, lean meats, and egg whites give you the most protein per calorie, with shrimp highest at 24.2 g of protein per 100 calories. If you count energy in kilojoules, 100 calories equal 418 kJ.
Chicken breast gives 18.8 g and ranks 13th. Peanut butter gives just 3.7 g. This list ranks 32 high-protein, low-calorie foods by protein per 100 calories, with the protein and calories in a typical serving of each.
How the Foods Are Ranked
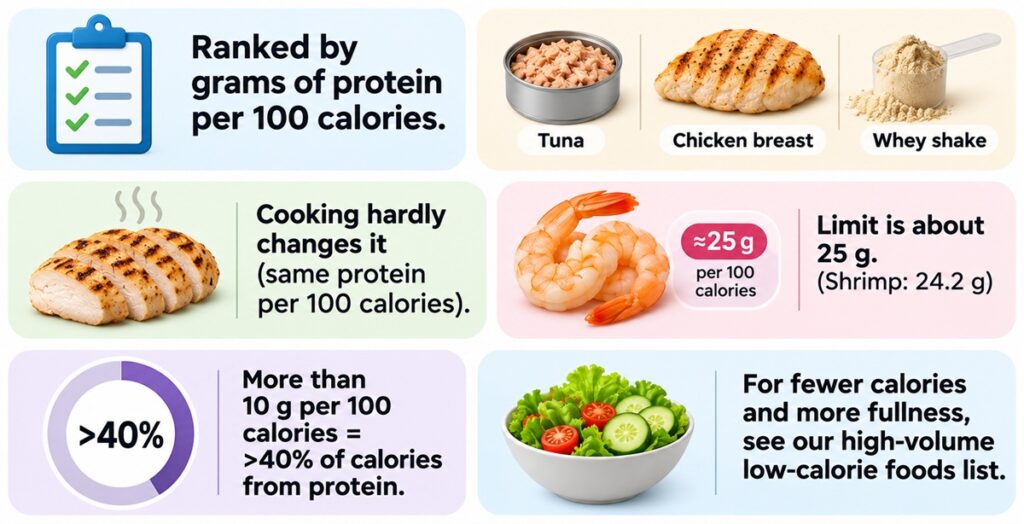
Every food here is ranked by its grams of protein per 100 calories, from USDA FoodData Central’s SR Legacy set. Cooked foods are shown as you eat them, with no added fat or breading. That lets you compare canned tuna, a roasted chicken breast, and a whey shake by the same measure.
Cooking hardly changes this measure because it mostly removes water, which raises protein and calories per 100 g by the same proportion. Skinless chicken breast gives 18.8 g of protein per 100 calories raw or roasted. Our protein in chicken breast guide explains why cooked chicken shows more protein per 100 g than raw.
No food can get far beyond about 25 g per 100 calories, since each gram of protein supplies about four calories. Shrimp, at 24.2 g, is close to that limit. Any food above 10 g per 100 calories gets more than 40% of its calories from protein. For foods that fill you up for fewer calories, see our high-volume low-calorie foods list.
High Protein Low Calorie Foods Ranked
These 32 foods are ordered by protein per 100 calories, from highest to lowest:
| Rank | Food | Protein per 100 calories (g) | Serving | Protein (g) | Calories (kJ) |
|---|---|---|---|---|---|
| 1 | Shrimp, cooked | 24.2 | 3 oz (85 g) | 20.4 | 84 (351) |
| 2 | Canned light tuna in water, drained | 22.6 | 3 oz (85 g) | 16.5 | 73 (305) |
| 3 | Alaska pollock, cooked | 22.3 | 3 oz (85 g) | 16.5 | 74 (310) |
| 4 | Atlantic cod, cooked | 21.7 | 3 oz (85 g) | 19.4 | 89 (372) |
| 5 | Blue crab, cooked | 21.6 | 3 oz (85 g) | 15.2 | 71 (297) |
| 6 | Egg white | 21.0 | 1 large (33 g) | 3.6 | 17 (71) |
| 7 | Fat-free liquid egg substitute | 20.8 | 1/4 cup (60 g) | 6.0 | 29 (121) |
| 8 | Tilapia, cooked | 20.5 | 1 fillet (87 g) | 22.8 | 111 (464) |
| 9 | Turkey breast, roasted, no skin | 20.5 | 3 oz (85 g) | 25.6 | 125 (523) |
| 10 | Venison tenderloin, broiled | 20.1 | 3 oz (85 g) | 25.4 | 127 (531) |
| 11 | Bison, lean, roasted | 19.9 | 3 oz (85 g) | 24.1 | 122 (510) |
| 12 | Beef eye of round steak, lean, grilled | 19.8 | 3 oz (85 g) | 25.1 | 127 (531) |
| 13 | Chicken breast, roasted, no skin | 18.8 | 3 oz (85 g) | 26.4 | 140 (586) |
| 14 | Scallops, steamed | 18.5 | 3 oz (85 g) | 17.4 | 94 (393) |
| 15 | Pork tenderloin, lean, roasted | 18.3 | 3 oz (85 g) | 22.3 | 122 (510) |
| 16 | Greek yogurt, plain, nonfat | 17.3 | 6 oz container (170 g) | 17.3 | 100 (418) |
| 17 | Cottage cheese, 1% fat | 17.2 | 1/2 cup (113 g) | 14.0 | 81 (339) |
| 18 | Sockeye salmon, cooked | 17.0 | 3 oz (85 g) | 22.5 | 133 (556) |
| 19 | Whey protein isolate powder | 16.2 | 1 scoop (28.7 g) | 16.7 | 103 (431) |
| 20 | Cottage cheese, nonfat dry curd | 14.3 | 1/2 cup (72.5 g) | 7.5 | 52 (218) |
| 21 | Ground beef, 93% lean, broiled | 13.6 | 3 oz (85 g) | 22.3 | 164 (686) |
| 22 | Tofu, extra firm | 12.0 | 1/5 block (91 g) | 9.1 | 76 (318) |
| 23 | Tofu, firm | 12.0 | 1/2 cup (126 g) | 21.8 | 181 (757) |
| 24 | Atlantic salmon, farmed, cooked | 10.7 | 3 oz (85 g) | 18.8 | 175 (732) |
| 25 | Tempeh | 10.6 | 3 oz (85 g) | 17.3 | 163 (682) |
| 26 | Skim milk | 9.9 | 1 cup (245 g) | 8.3 | 83 (347) |
| 27 | Edamame, cooked | 9.8 | 1 cup (155 g) | 18.4 | 188 (787) |
| 28 | Whole egg | 8.8 | 1 large (50 g) | 6.3 | 72 (301) |
| 29 | Lentils, boiled | 7.8 | 1/2 cup (99 g) | 8.9 | 115 (481) |
| 30 | Black beans, boiled | 6.7 | 1/2 cup (86 g) | 7.6 | 114 (477) |
| 31 | Green peas, boiled | 6.4 | 1/2 cup (80 g) | 4.3 | 67 (280) |
| 32 | Chickpeas, boiled | 5.4 | 1/2 cup (82 g) | 7.3 | 134 (561) |
The seafood rows and egg whites rank above chicken because they contain almost no fat. Shrimp has 0.28 g of fat per 100 g, cod has 0.86 g, and egg white has 0.17 g. Chicken breast is still a good weeknight choice. A 3-oz serving of roasted chicken breast without skin gives 26.4 g of protein for 140 calories.
Some foods near the top come with a trade-off. Scallops have 667 mg of sodium per 100 g, and 1% fat cottage cheese has 406 mg. Blue crab has 395 mg and canned light tuna has 247 mg. For shrimp, it’s cholesterol, at 189 mg per 100 g.
Products vary, so go by your label when it differs. USDA’s canned light tuna entries give between 19.4 and 25.5 g of protein per 100 g. Whey scoop sizes differ by brand.
Not every component of eggs has the same nutrition makeup. An egg white provides 21.0 g of protein per 100 calories, while a whole egg provides 8.8 g per 100 calories. Our calories in eggs guide compares whites, whole eggs, and egg sizes.
Calories It Takes to Get 25 Grams of Protein
Getting 25 g of protein from 12 common foods takes these calories and amounts:
| Food | Calories for 25 g of protein | Amount of food |
|---|---|---|
| Shrimp | 103 | 104 g (3.7 oz) |
| Canned light tuna | 111 | 129 g (4.6 oz) |
| Egg whites | 119 | about 7 large |
| Chicken breast, roasted | 133 | 81 g (2.8 oz) |
| Greek yogurt, nonfat | 145 | 245 g (8.6 oz) |
| Whey protein isolate | 154 | 43 g |
| Ground beef, 93% lean | 184 | 95 g (3.4 oz) |
| Tofu, firm | 208 | 145 g (5.1 oz) |
| Whole eggs | 284 | about 4 large |
| Lentils, boiled | 322 | 277 g (about 1.4 cups) |
| Peanut butter | 673 | 113 g (about 7 tbsp) |
| Almonds | 683 | 118 g (about 4.2 oz) |
Twenty-five grams falls toward the minimum of the recommended 25–30 g per meal.
Peanut butter and almonds show why protein per gram can mislead you. They have 22.2 g and 21.2 g of protein per 100 g, close to cooked cod at 22.8 g. For 25 g of protein, though, peanut butter takes 673 calories and almonds take 683. Shrimp takes 103.
Why Protein per Calorie Matters More on a GLP-1 Medicine
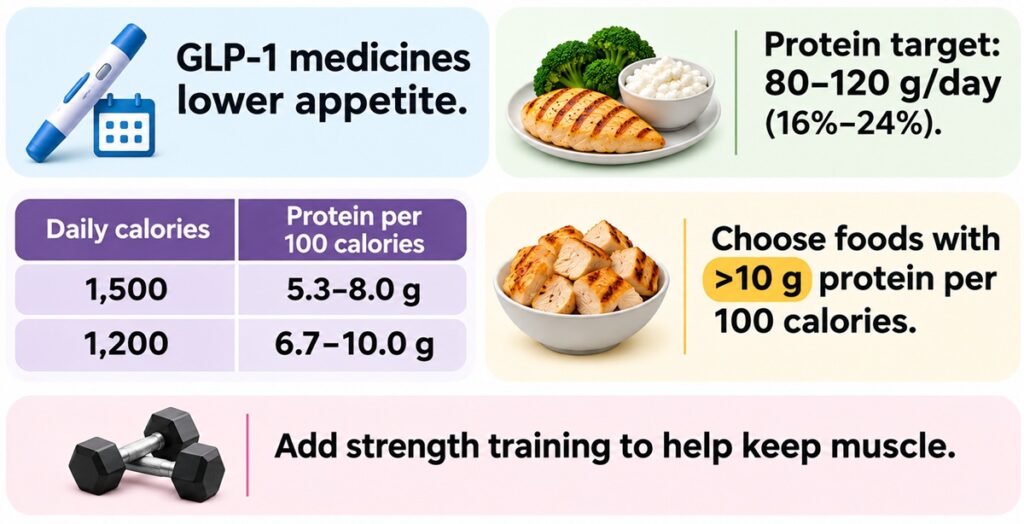
Semaglutide (sold as Wegovy and Ozempic) and tirzepatide (sold as Zepbound and Mounjaro) reduce appetite, so you eat less when taking them. For people taking these medicines, a 2025 joint nutrition advisory gives a fixed protein target of 80–120 g a day as a simpler alternative to a per-kilogram target. That’s 16%–24% of the calories on a 2,000-calorie diet.
The target is set in grams, so when you eat less, the same grams have to come from fewer calories. For a 1,500-calorie example day, that’s an average of 5.3–8.0 g of protein per 100 calories. For a 1,200-calorie example day, it’s 6.7–10.0 g. Both calorie levels are examples picked to show the arithmetic.
Most of your protein then needs to come from foods giving well over 10 g per 100 calories, near the top of the ranked table. The advisory adds that protein by itself probably won’t preserve muscle unless you also do strength training. Our protein and muscle guide for GLP-1 users covers daily amounts and muscle loss.
Plant Foods With the Most Protein per Calorie
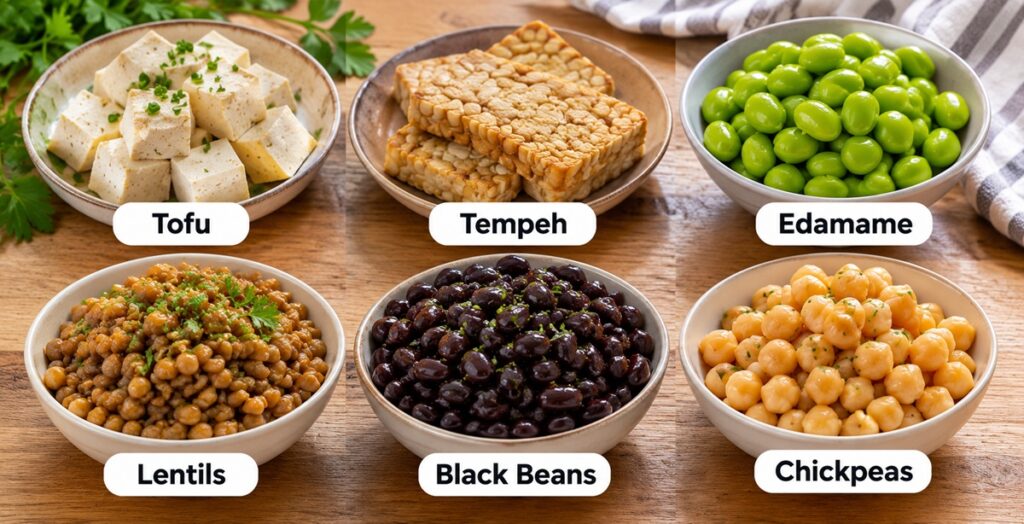
Among plant foods, tofu, tempeh, and edamame rank highest. Extra-firm and firm tofu both give 12.0 g per 100 calories, tempeh 10.6 g, and cooked edamame 9.8 g. Lentils give 7.8 g, black beans 6.7 g, and boiled chickpeas 5.4 g.
Even tofu ranks only 22nd of 32. Every meat and poultry row ranks higher, and so does every yogurt and cottage cheese row. Beans and lentils contain carbohydrates and fiber along with their protein, and the carbohydrates lower their protein per calorie. That doesn’t make them poor foods, but the same protein takes more food and more calories.
Tofu’s protein depends heavily on the type. USDA entries range from about 7 g of protein per 100 g for soft tofu to 17.3 g for firm, so match the type on your package. Seitan has no USDA standard entry, so check the label if you buy it.
What Lean Protein Means on a Food Label
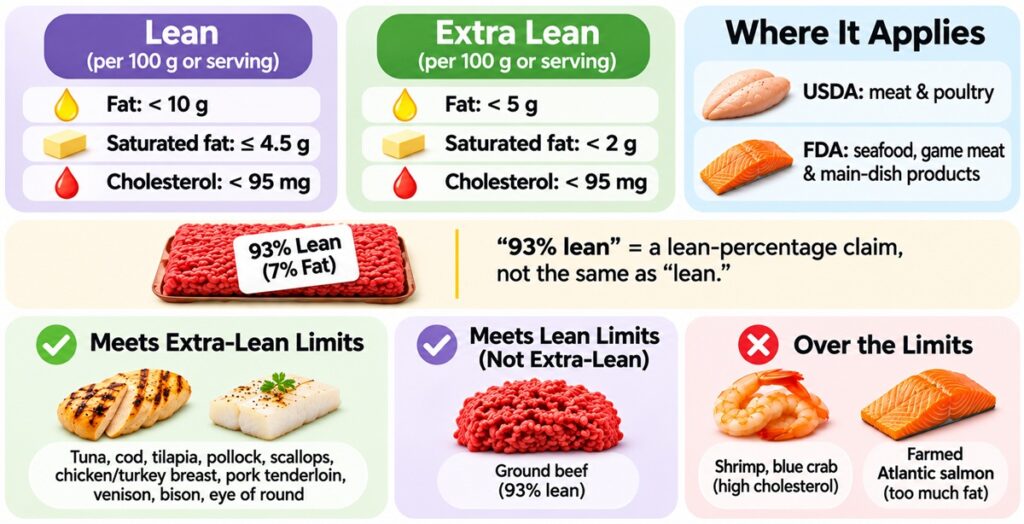
Lean protein is an everyday phrase, but on a US food label, lean is a defined term with federal limits. To be labeled lean, a food needs under 10 g of fat, 4.5 g or less of saturated fat, and under 95 mg of cholesterol. Those limits apply per 100 g and per serving. Extra lean lowers the limits to under 5 g of fat and under 2 g of saturated fat and keeps the cholesterol limit.
USDA applies these terms to meat and poultry. Under FDA rules, the word can appear only on seafood, game meat, and meal or main-dish products. That’s why you won’t see it on yogurt or cottage cheese, even when their numbers fit.
A 93% lean label on ground beef says something else. It’s a lean-percentage claim, and the fat percentage has to appear next to it on the label. It doesn’t mean the package meets the lean definition.
On the table’s USDA figures per 100 g of cooked food, these foods meet the extra-lean limits: tuna, pollock, cod, tilapia, scallops, turkey and chicken breast, pork tenderloin, venison, bison, and eye of round. Ground beef at 93% lean meets the lean limits but not the extra-lean ones. Shrimp (189 mg) and blue crab (97 mg) are over the cholesterol limit, and farmed Atlantic salmon is over the fat limit at 12.4 g. That’s a check on the cooked numbers only, and a package label can still differ.
Does Eating More Protein Help You Lose Weight?
Eating more protein helps you lose a little more weight in controlled trials. A 2012 review pooled 24 trials in which 1,063 adults cut calories for about 12 weeks. The higher-protein groups lost about 1.7 lb more body weight than the standard-protein groups, and 1.9 lb more fat. They also lost about 0.9 lb less lean mass.
In a 12-week study, 19 adults went from 15% to 30% of their calories as protein, with no instruction to eat less. They ate about 441 fewer calories a day. That fits the modest effect on fullness seen in short trials, but it comes from a small study with no separate control group. Both results are small and short-term, and neither predicts what you’ll lose.
How Much Protein You Need in a Day
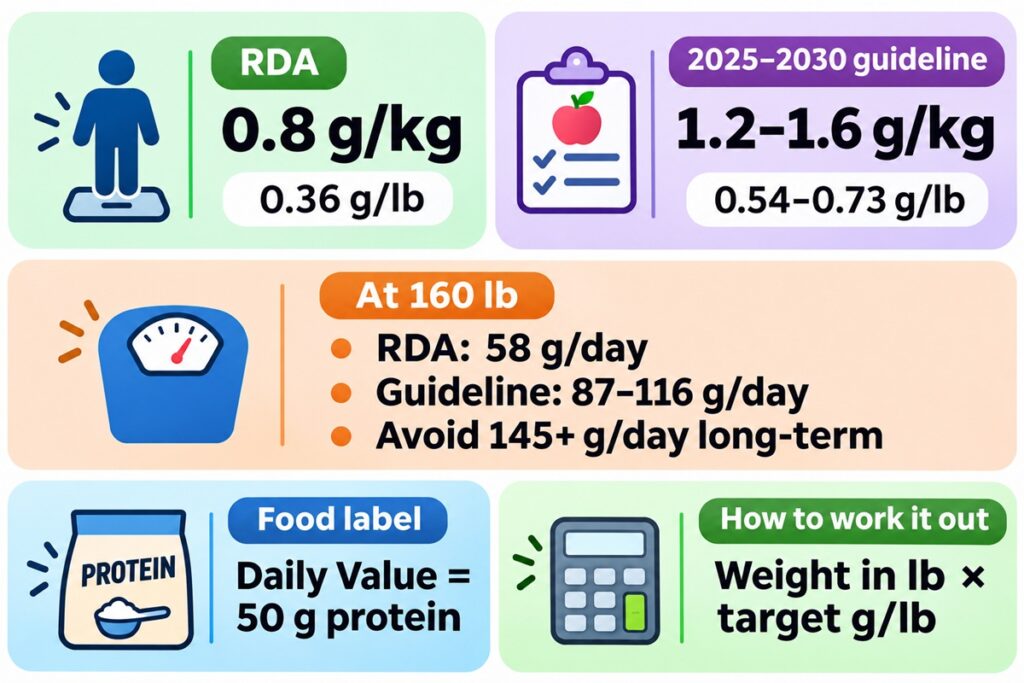
For protein, the Recommended Dietary Allowance (RDA) is 0.8 g a day for each kilogram of body weight, about 0.36 g per pound. It’s now under review. The 2025–2030 Dietary Guidelines call for 1.2–1.6 g per kilogram, or 0.54–0.73 g per pound.
At 160 lb, the RDA works out to 58 g a day and the guideline range to 87–116 g. The 2025 GLP-1 advisory recommends against eating 2 g per kilogram or more over long periods. For the same person, that’s about 145 g a day. The Daily Value for protein on food labels is 50 g.
To find your own number, multiply your weight in pounds by the per-pound figure that fits you. Then pick most of your protein from the higher-ranked foods, so you reach that number within your daily calorie needs.
If you have kidney disease, check with your doctor or a dietitian before eating more protein. People with chronic kidney disease are often advised to limit it.
Sources
- Protein ranking: USDA FoodData Central, SR Legacy, 2019; FDA 21 CFR 101.9, 2023
- GLP-1 medicines: Mozaffarian et al., Am J Clin Nutr, 2025
- Lean labels: FDA 21 CFR 101.62, 2016; USDA FSIS 9 CFR 317.362, 2016; USDA FSIS 9 CFR 381.462, 2016
- Protein and weight loss: Wycherley et al., Am J Clin Nutr, 2012; Weigle et al., Am J Clin Nutr, 2005; Leidy et al., Am J Clin Nutr, 2015
- Daily protein: Mozaffarian et al., Am J Clin Nutr, 2025; USDA and HHS Dietary Guidelines for Americans, 2025 to 2030; FDA 21 CFR 101.9, 2023